Subject: Project Management · Type: Coursework · Level: Masters · ~3,001 words
A real academic coursework sample. Provided for reference and learning — please do not submit it as your own work.
Introduction
Project management is considered to be an important field where the knowledge, skills, techniques and tools enable in meeting the project requirement within the deadline (Radujković and Sjekavica, 2017). The following task reflects on applying the project management skills, techniques and tools to the development of Tesla’s Gigafactory project. Tesla has developed a future project in the development of the Gigafactory in Austin, Texas, which is estimated to begin in the period January 1, 2022, and is expected to be completed in 2024. The company has revealed that the cost of the project is estimated to be $1 billion. Therefore, the following task reflects the evaluation of project management methodologies for implementation in the success of the project. In addition to this, the costs of the activities are developed, along with highlighting the useful tools for project management.
Main Discussion
Methods of project planning and project control (Q1)
To ensure the success of Tesla’s Gigafactory project, the methods for the project planning and project control that are determined are the work breakdown structure (WBS), network diagram, Gantt chart and critical path. Therefore, each of these methods is discussed in the section which is provided below:
- Work Breakdown Structure (WBS): As per the study of Sutrisna, Ramanayaka and Goulding (2018), the WBS was mainly developed for gaining an understanding of the project scope. It reflects the hierarchical description regarding the activities that are required to be completed for the project. The WBS is considered to be an effective method for project planning, controlling, executing, monitoring and reporting.
- Network diagram: According to the study of Bondarenko et al. (2018), the network diagram is reflected in the development and documenting of the sequence of the activities. The network diagram is generally a graphical representation of the activities along with their relationship and dependencies. With the help of the network diagram, the user can determine the critical path and also gain a schedule of the entire project. The activities in the network diagram are represented by arrows that are connected.
- Gantt Chart: The Gantt chart, as described in the study of Trojanowska and Dostatni (2017), is commonly used in the field of project management and is considered to be a popular and useful method for showing the activities and their time frame. Gantt chart is commonly utilized for tracking the schedules of the project, which also represents the additional information for each of the tasks.
- Critical path analysis: Critical path analysis is referred to as the technique of project management, which requires mapping out the key tasks that are particularly dependent on the other tasks for ensuring that the project is completed within the timeframe (Ba’Its, Puspita and Bay, 2020).
Based on the importance of these methods it is applied to Tesla’s Gigafactory project for determining the activities of the projects and their importance.
Work Breakdown Structure (Q2)
The WBS of Tesla’s Gigafactory project is provided in Figure 1, where there are mainly two phases involved in the project as per the provided scenario. The first phase in the project is mainly associated with the infrastructure, where there are a total of 9 activities involved in the development of the complete infrastructure. The 9 activities that are involved in Phase 1 include site selection, land preparation, design activity, planning, construction of the building, construction of the roof, plumbing, electrics and inspection. Therefore, the first phase of the project is purely associated with the complete development of the Gigafactor in Austin, Texas, where the last phase requires the inspection. The second phase of the project is based on the internal assembly and support system. There are particularly six activities that are involved in the project, which are regarding the battery and drivetrain assembly, seat assembly area, final vehicle assembly area, paint and ventilation area, central supply building and test track. Hence, the second phase of the project pertains to the development of an assembly system that has a robotic manufacturing process involved in which the parts of the vehicles are added in a sequence for the final product development.
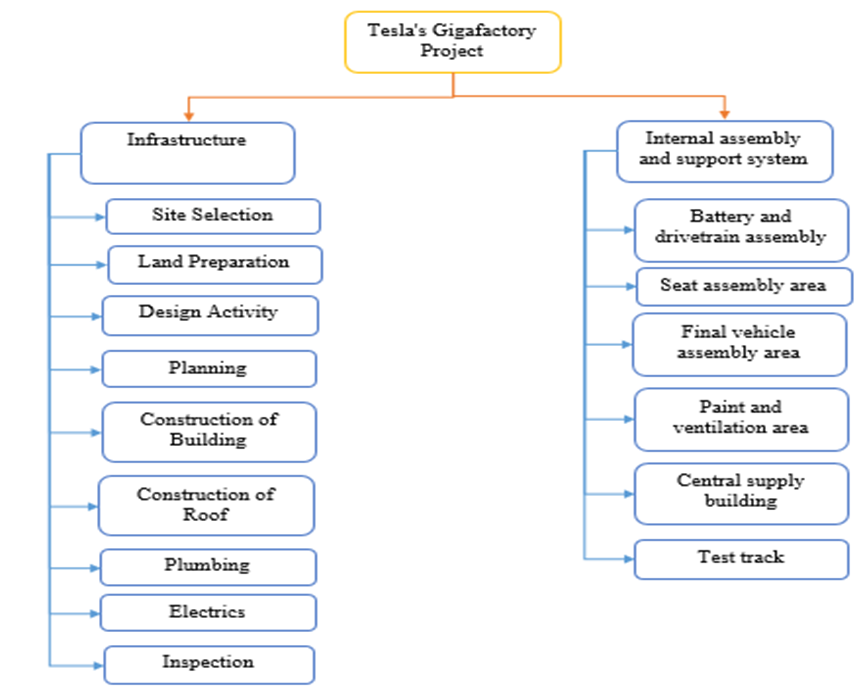
Figure 1: Work Breakdown Structure
Network Diagram (Q2)
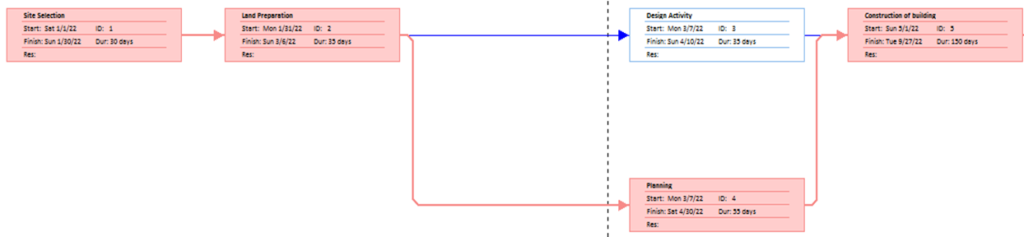
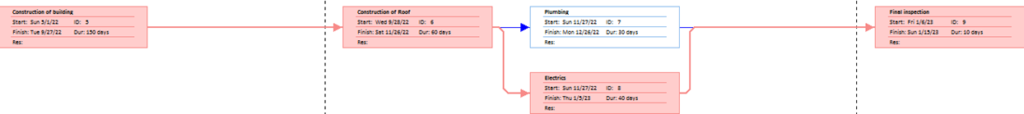
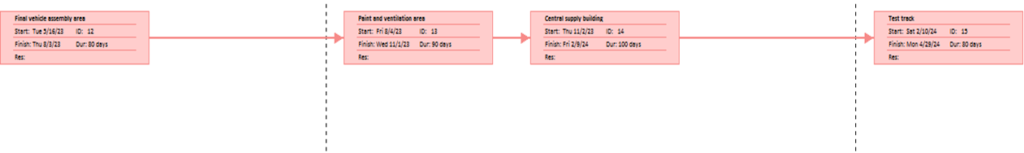
The network diagram for Tesla’s Gigafactor is developed based on determining the predecessors or dependencies of the activities. Table 1 shows the activities and their dependence on the other activities where the identification has been supported in developing the network diagram. As per the table, the first process would mainly begin with the site selection. Where once the activity is completed, the second activity would immediately begin, which is regarding the land preparation. Hence, the table provided the details as to which activities are dependent on the other activities. With the determination of the predecessors, the next technique that was applied was the network diagram, which is provided in Appendix 1. The network diagram is provided with the help of the Microsoft project. The red boxes in the diagram represent the critical activities, whereas the blue boxes represent the non-critical activities.
Table 1: Activities and Duration
| Activity ID | Activity Name | Predecessor | Duration (Days) |
| A | Site Selection | 30 | |
| B | Land Preparation | A | 35 |
| C | Design Activity | B | 35 |
| D | Planning | B | 55 |
| E | Construction of building | C,D | 150 |
| F | Construction of Roof | E | 60 |
| G | Plumbing | F | 30 |
| H | Electrics | F | 40 |
| I | Final inspection | G,H | 10 |
| J | Battery and drivetrain assembly area | I | 70 |
| K | Seat assembly area | J | 50 |
| L | Final vehicle assembly area | J | 80 |
| M | Paint and ventilation area | L | 90 |
| N | Central supply building | M | 100 |
| O | Test track | N | 80 |
Gantt chart (Q2)
With the help of the Microsoft Project, the Gantt chart for Tesla’s Gigafactory is developed for the project. The Gantt chart for the project in Figure 2 is based on 7 working days and as per the provided duration for each of the activities. As per the chart and the instructions, the project would start on January 1st, 2022, and the first phase of the project is expected to be completed on 15th January 2023. The second phase of the project would start on 16th January 2023, where it is estimated to be completed on 29th March 2024. Therefore, this indicates that the entire project would be completed on 29th March 2024. On the other hand, it was specified that from the instruction that the project must be completed on 1st January 2024. Therefore, the current schedule of the projects depicts that it would not be able to be completed as per the project. The Gantt schedule is developed based on 7 days, where the working period would be from 8:00 AM to 12:00 PM and 1:00 PM to 5:00 PM.
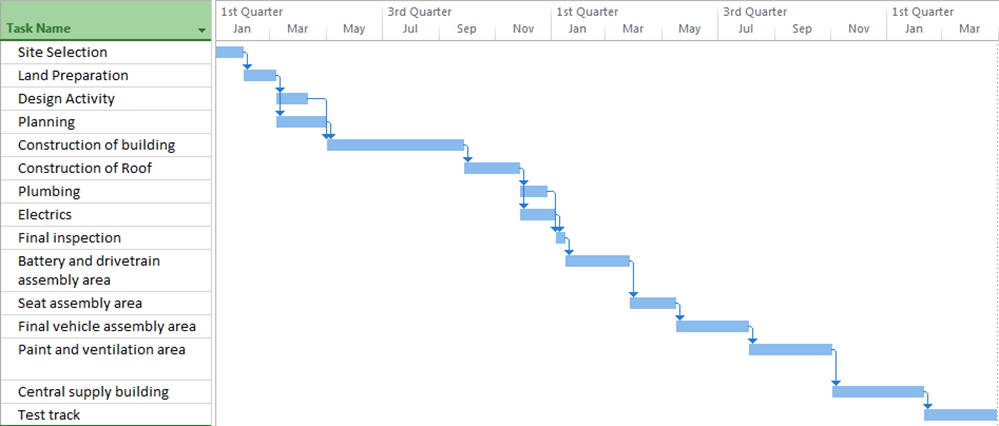
Figure 2: Gantt chart as per the normal working time on 7 days
Critical Path of the Project (Q2)
The critical path of the project is developed based on the network diagram, where it was conducted with the support of the Microsoft Project. The critical activities are only referred to as the key activities, whereas the other activities are dependent on their completion. Table 2 reflects the critical path of the project where it was determined that the highly critical activities were site selection, land preparation, planning, construction of building, construction of roof, electrics, final inspection, batter and drivetrain and assembly area, seat assembly area, final vehicle assembly area, paint and ventilation area, central supply building and test track. The activities that are not found to be the critical activities are design activity (c) and plumbing (g). Hence, these activities can be ignored while the other activities are required to be essentially completed.
Table 2: Critical Path of the Project
| Activity ID | Task Name | Duration | Critical |
| A | Site Selection | 30 | Yes |
| B | Land Preparation | 35 | Yes |
| D | Planning | 55 | Yes |
| E | Construction of building | 150 | Yes |
| F | Construction of Roof | 60 | Yes |
| H | Electrics | 40 | Yes |
| I | Final inspection | 10 | Yes |
| J | Battery and drivetrain assembly area | 70 | Yes |
| K | Seat assembly area | 50 | Yes |
| L | Final vehicle assembly area | 80 | Yes |
| M | Paint and ventilation area | 90 | Yes |
| N | Central supply building | 100 | Yes |
| O | Test track | 80 | Yes |
| Total Duration as per the critical path | 850 |
Project Completion Date (Q2)
As per the scenario, the project is estimated to start at the period of 1st January 2022, while the project is expected to be completed on March 29th, 2024, as per the schedule that is determined through the network diagram and Gantt chart. This indicates that the actual completion date of the project is not per its expected completion date, which was estimated to be 1st January 2024. There is a difference of 88 days, where the project is expected to exceed 88 days as per the critical activities. Moreover, the total duration that is determined as per the critical path activities comprises 850 days. Therefore, this indicates that the project is estimated to be completed in 850 days which is significantly higher than the expected date.
Timing Schedule Improvement (Q2)
As the timeline of the project was exceeded by 88 days when the project was estimated to be completed on March 29th, 2024, while it was expected to be completed by 1st January 2020, it was crucial to improve the timing schedule of the entire project. As indicated above, the initial scheduling of the project was developed based on 7 working days from 8:00 AM to 5:00 PM, which is considered to be a standard period. The timing schedule can be improved by working on the project at 24/7 hours working period. This would not only enable completing the project within the expected deadline but would also cause the project to be completed in less amount of time. The major drawback of this strategy is that it would lead to an increase in the overall costs, particularly the labour costs. Figure 3 reflects the Gantt chart of the project that would be completed based on 24 hours time period. As per the chart, the entire project will be completed on 11th October 2022. Therefore, this would lead to a significant decline in the entire timeline. Another major drawback is that there would be high errors in the project as the labour would be engaged 24/7, which would result in causing high errors due to workload stress.
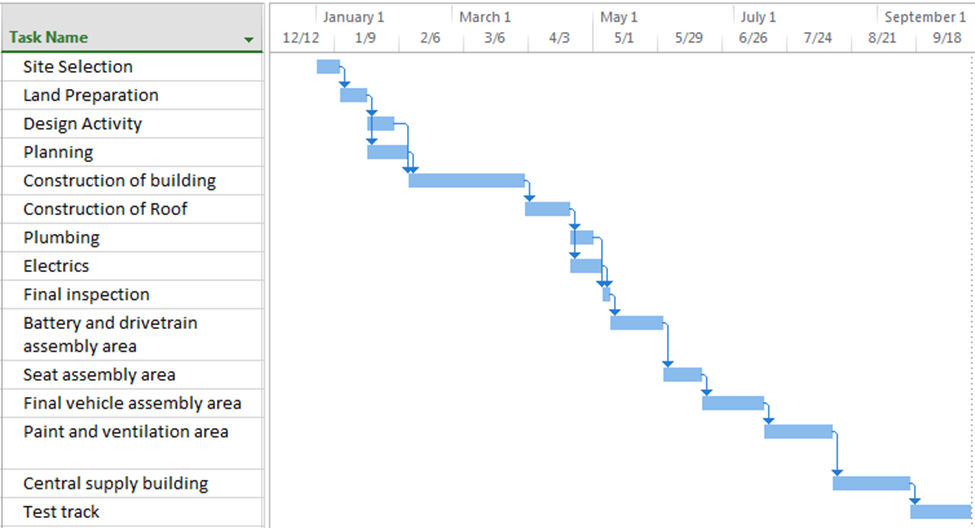
Figure 3: Gantt chart as per 24 hours
Project Budget and Estimation cost (Q3)
The project budget and estimation cost for each activity are provided in Table 3, where the costs are provided based on assumptions. The first element is the site selection, where it was determined that Tesla had paid $97 million for a factor site in East Austin (Edgemon, 2020). The cost for land preparation is $3.8 million, where the total square feet of the purchased land is 1.9 million, while the average cost for land clearing is $2 (Home Advisor, 2021). The designing and planning activity cost for Tesla Gigafactory is $15,000,000 (Hidalgo, 2015). Moreover, the construction of the building, construction of the roof, plumbing and electrics is determined to be $750 million. Similarly, it was determined that New York is committed to helping build the infrastructure by $750 million (Bloomberg, 2018). The final inspection cost is estimated to be $304,000, as the inspection cost for a building that is above 3000 square feet is $0.16 (Austin Structural, 2021). The total costs that are estimated based on the other activities are $994,054,000, which is below $1 billion. However, since the project is estimated to be completed on March 29th, 2024, there is a delay of 88 days. Moreover, it is estimated that there will be an additional cost of 1 million with each delayed day. Therefore, the cost of delaying the project by 88 days is $88,000,000. The finalized cost for the entire project is $1,082,054,000, which is above $1 billion.
Table 3: Project Budget and Estimation Cost
| Activity ID | Phase Number | Phase Description | Activity Name | Costs |
| A | One | Infrastructure | Site Selection | $ 97,000,000 |
| B | One | Infrastructure | Land Preparation | $ 3,800,000 |
| C | One | Infrastructure | Design Activity | $ 7,500,000 |
| D | One | Infrastructure | Planning | $ 7,500,000 |
| E | One | Infrastructure | Construction of building | $ 750,000,000 |
| F | One | Infrastructure | Construction of Roof | |
| G | One | Infrastructure | Plumbing | |
| H | One | Infrastructure | Electrics | |
| I | One | Infrastructure | Final inspection | $ 304,000 |
| J | Two | Internal assembly and Support systems | Battery and drivetrain assembly area | $ 3,950,000 |
| K | Two | Internal assembly and Support systems | Seat assembly area | $ 2,000,000 |
| L | Two | Internal assembly and Support systems | Final vehicle assembly area | $ 20,000,000 |
| M | Two | Internal assembly and Support systems | Paint and ventilation area | $ 2,000,000 |
| N | Two | Internal assembly and Support systems | Central supply building | $ 60,000,000 |
| O | Two | Internal assembly and Support systems | Test track | $ 40,000,000 |
| Total Cost | $ 994,054,000 | |||
| Additional cost due to delaying of the project by 88 days | $ 88,000,000 | |||
| Finalized Cost | $ 1,082,054,000 |
Limitations of Estimated Costs (Q3)
The major limitation of the estimated costs is that it is purely based on assumptions where the changes of the economic factors such as inflation, interest and exchange rate can cause major changes to the estimated costs. Moreover, another issue with the estimated costs is that it can lead to the misrepresentation of the project status, which can result in causing complexity among the project activities (McKaskle, 2020).
Project management methodologies can be used for implementing this project (Q4)
While referring to Tesla’s Gigafactor project, several project management methodologies can be utilized for implementing the project. Some of the project management methodologies include PRINCE2, waterfall and agile. PRINCE2, as defined in the study of Vaníčková (2017), is the method of project management that divides the project into manageable and controllable phases. The term PRINCE 2 is defined as projects in a controlled environment where it is recognized throughout the globe. The benefits for the organization by using this tool is that it is considered to be a common and consistent approach while it enables in controlling and systematically organizing the projects. While referring to the waterfall, the study of Thesing, Feldmann and Burchardt (2021) has indicated that it is an approach to project management that enables completing the project in distinct stages. The Waterfall project methodology is suitable for projects that have long and detailed plans which require a single timeline. Lastly, agile project management is also suitable with the project where it can be applied to shorter projects and also involves working on overlapping activities, as observed in Tesla’s Giga factory. Therefore, the project management methodologies that can be implemented with the project are PRINCE2, waterfall and agile project management.
Conclusion
The report was purely based on evaluating Tesla’s Gigafactor project by applying the appropriate techniques, which include the WBS, network diagram, Gantt chart, critical path and others. As per the scenario of the project provided, there are particularly two phases that are mainly involved in the project, which are infrastructure and the internal assembly and support system. As per the WBS, the total number of activities that are involved in the project is 9, while the total project in the second phase is 6 activities. With the development of the network diagram and the Gantt chart, it was identified that the project would be completed on 29th March 2024, where it was expected that it would be completed on 1st January 2024. This indicates that the project completion would lead to an additional 88 days based on 7 days working period. Moreover, the delaying of the project would lead to major additional costs for the project.
Recommendation
A few recommendations are provided for Tesla to improve its development of the project Gigafactory in Austin, which are the following:
- It is recommended for the organization to increase its overall budget in its project where it is difficult to cover the overall costs at a $1 billion budget.
- It is suggested for Tesla to increase the working period of the labour, which would enable the development of the project. The consequence of the strategy is that it would lead to higher costs.
References
Austin Structural. 2021. Austin Home Inspector Prices for Home Inspections. Available at: https://austinstructural.com/prices/ (Accessed: 30 June 2021).
Ba’Its, H.A., Puspita, I.A. and Bay, A.F., 2020. Combination of program evaluation and review technique (PERT) and critical path method (CPM) for project schedule development. International Journal of Integrated Engineering, 12(3), pp.68-75.
Bloomberg 2018. Tesla Powers Up New York Gigafactory Solar Roof Assembly Line, IndustryWeek. Available at: https://www.industryweek.com/leadership/companies-executives/article/22024892/tesla-powers-up-new-york-gigafactory-solar-roof-assembly-line (Accessed: 30 June 2021).
Bondarenko, S., Lagodienko, V., Sedikova, I. and Kalaman, O., 2018. Application of project analysis software in project management in the pre-investment phase. Journal of Mechanical Engineering and Technology, 9(13), pp.676-684.
Edgemon, E. 2020. Tesla paid $97M for factory site in far East Austin; seller reveals Bizjournals.com. Available at: https://www.bizjournals.com/austin/news/2020/08/07/tesla-buys-far-east-austin-factory-site-for-97m.html (Accessed: 30 June 2021).
Hidalgo, J. 2015 Rgj.com. Available at: https://www.rgj.com/story/money/reno-rebirth/2015/04/16/tesla-motors-gigafactory-construction-permits-past-62-million-dollars/25853613/ (Accessed: 30 June 2021).
Home advisor. 2021. Learn how much it costs to Clear Land or Prepare a Construction Site. Available at: https://www.homeadvisor.com/cost/landscape/clear-land-or-prepare-a-construction-site/ (Accessed: 30 June 2021).
McKaskle, R., 2020. Site Infrastructure Development and Estimated Costs (Deliverable 7.1) (No. DOE-SSEB-0029465-55). Southern States Energy Board, Peachtree Corners, GA (United States).
Radujković, M. and Sjekavica, M., 2017. Project management success factors. Procedia engineering, 196, pp.607-615.
Sutrisna, M., Ramanayaka, C.D. and Goulding, J.S., 2018. Developing work breakdown structure matrix for managing offsite construction projects. Architectural engineering and design management, 14(5), pp.381-397.
Thesing, T., Feldmann, C. and Burchardt, M., 2021. Agile versus Waterfall Project Management: Decision Model for Selecting the Appropriate Approach to a Project. Procedia Computer Science, 181, pp.746-756.
Trojanowska, J. and Dostatni, E., 2017. Application of the theory of constraints for project management. Management and production engineering review, 8.
Vaníčková, R., 2017. Application of PRINCE2 project management methodology. Studia Commercialia Bratislavensia, 10(38), p.227.
Appendices
Appendix 1: Network Diagram
Phase 1
Phase 2

Need a custom coursework like this?
Get an original, expertly written Project Management coursework tailored to your brief — fully referenced and plagiarism-checked.
Get expert help →